Tutorial 5: Don't Miss It Next Time: Trend Following Pattern Predicted Crypto Pump
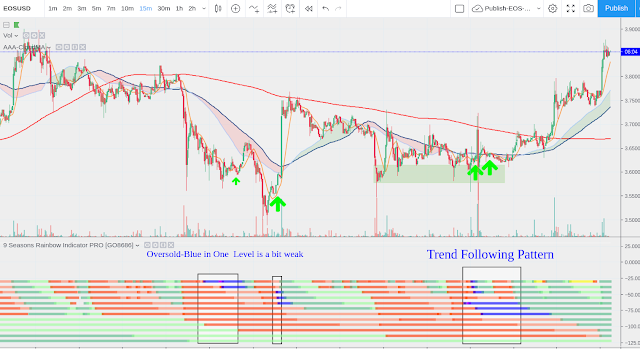
This education idea is about "Trend Following Pattern" using "9 Seasons Rainbow Indicator PRO".
This time, it serves as a BottomFinder perfectly.
Yesterday, just before the Dogi, 9 Seasons Rainbow Indicator PRO indicated that a "Trend Following Pattern" had formed:
This time, it serves as a BottomFinder perfectly.
Yesterday, just before the Dogi, 9 Seasons Rainbow Indicator PRO indicated that a "Trend Following Pattern" had formed:

Charting on Tradingview
OverSold(Blue) in multiple time frames: 15m, 21m,30m 84m, 2H - meaning strong support and the adjustment might completed.
Bear(Red) in 170m, 4H, 339m, 8H: - meaning the medium time frames is Bear Context
BullRest(Light Green) in 11H, 16H, 23H - meaning the big time frames is Bull Context -(need to check the last two on 30m)
Summary: On big time frames Bull Context, medium time frames adjustment almost completes, so it is a good time to follow big time frames' Bull Trend.
Some similar Instances for EOSUSD that Trend Following Pattern applied: - Please Scroll the chart to See
20190312 06:30
20190311 19:00 (Oversold-Blue in One Level is a bit weak)
20190304 16:00
20190302 22:00 (Oversold-Blue in One Level is a bit weak)
20190227 04:00
What did it serve the last time? A TopFinder and Dump predictor: "Why Do People Ignore the Foot Steps of a Huge Bear?"
https://www.tradingview.com/chart/BTCUSD/4AHrg4l1-Why-Do-People-Ignore-the-Foot-Steps-of-a-Huge-Bear/
DISCLAIM
This is only a personal opinion and does NOT serve as investing NOR trading advice.
Please make their own decisions, carefully assess risks and be responsible for your own investing and trading activities.

Comments
Post a Comment