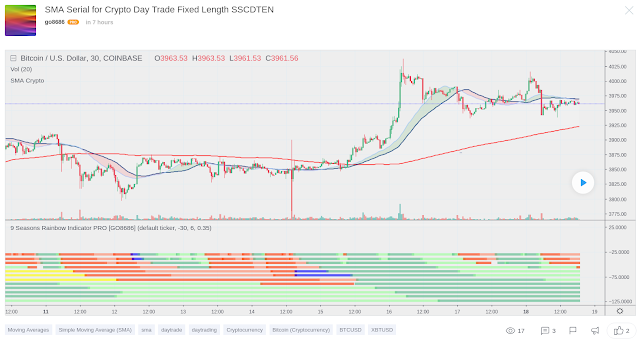
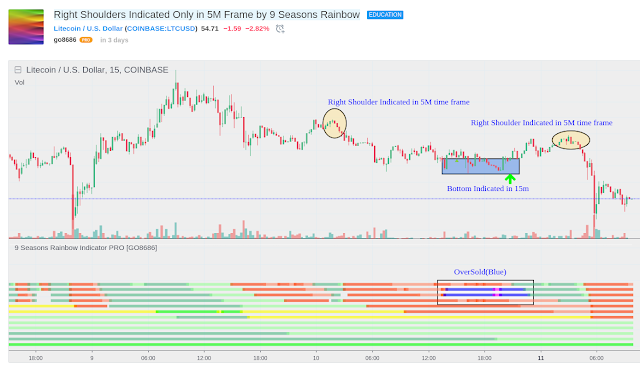
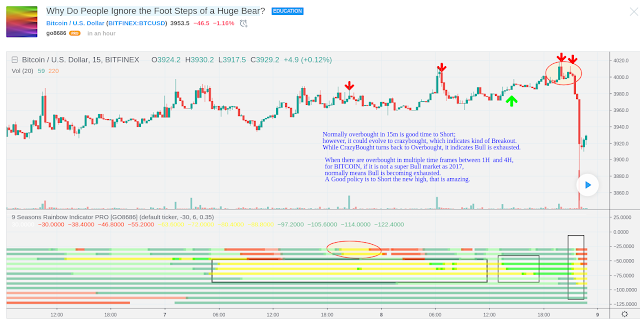
Posts

Showing posts from March, 2019

異なる期間の傾向が対立するとき

Image
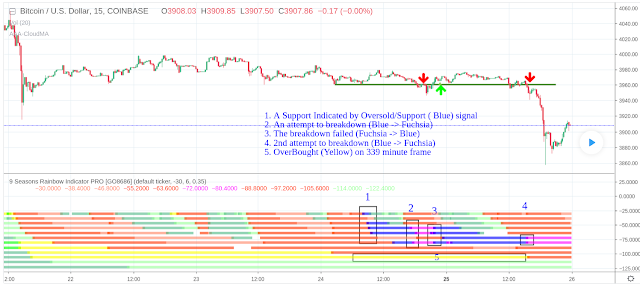
価格はさまざまな期間に重なる価格活動の波であるため、取引は複雑です。 charting on tradingview 短期、中期、および長期の時間枠の傾向が同じ方向に動く場合、全体的な価格の傾向は明らかです。 一方、異なる期間の傾向が互いに逆の場合、価格は統合されており、価格の傾向を予測するのは困難です。 これは過去2日間のBTCUSDで起こりました。 短期から中期(15分 - > 2時間)には、複数の売られ過ぎ/支持(青)のシグナルがあり、強い支持を示しています。 長期間(169分、4時間)には、弱(赤)の信号があります。 339分で、買われ過ぎ/抵抗(黄色)のシグナルがあります。 4時間678分に、Bull Pullback(薄緑色)信号があります。 青と薄緑色は長い電力を示し、赤と黄色は空の電力を示します。互いに対立する複数の時間ディメンションのこのパターンは、市場の統合を反映しています。長短双方が勝つと信じています。 したがって、この状況に対処するための方針は、統合が破られるまでトランザクションから離れることです。 「9 Seasons Rainbow Multiple Time Frames Pattern」によって与えられる有用な信号の1つは、売られ過ぎ/サポート(青) - >クレイジー(フクシア)です。反転すると、マゼンタが青色に戻り、飛躍的な失敗を示します。 昨日、私は2度突破しようとしました。初めて失敗し、2回目に成功しました。 経験、指標からのシグナル、他のトレーダーからのアイデア、ニュース、さらには感情さえも含めて、得られるすべての情報を組み合わせて判断を下すことがあります。昨日の私の意見では、「Bitcoinは小さな二重底を築き、4050年の圧力は再び長期的な課題に直面する可能性が高い」との見方を示しています。これは私にとっての教訓です。客観的事実に焦点を当て、あらゆる種類のノイズを無視することが重要です。

教程 6: 当不同时间段的趋势发生冲突时

Image
交易是复杂的,因为价格是不同时间段上价格活动叠加的波。  Charting on Tradingview 当短期,中期和长期时间框架的趋势向同一方向移动时,整体而言价格趋势是明确的。  另一方面,当不同时间段的趋势相互对立时,价格盘整且价格趋势难以预测。  过去两天内,这发生在BTCUSD。  在短期到中期的时间范围内(15分钟 - > 2H),有多个超卖/支撑(蓝色)信号,这表明了强有力的支持。  在长期时间范围(169分钟,4H),有熊(红色)信号。  在339分钟,有超买/阻力(黄色)信号。  在4H,678分钟,有Bull Pullback(浅绿色)信号。  蓝色和浅绿色显示多头力量,而红色和黄色显示空方力量。这种彼此对立的多时间维度的模式反映了市场的盘整情况。多空双方都相信自己这一方会赢。  因此,处理这种情况的政策是远离交易,直到盘整被打破。  9 Seasons Rainbow Multiple Time Frames Pattern”给出的一种有用信号是超卖/支持(蓝色) - >狂卖(紫红色),表示出现向下破位的尝试。如果它反转,紫红色变回蓝色,表示突破失败。  昨天有两次尝试突破,第一次失败,而第二次成功。  有时,人们通过结合他们获得的所有信息来做出判断,包括他们的经验,来自指标的信号,来自其他交易者的想法,新闻,甚至他们的情绪。在我昨天的观点“比特币构筑小双底,4050压力位恐面临多头再次挑战”中,我认为失败的破位将导致重新测试4050阻力,这已被证明与实际价格走势相反。这对我来说是一个教训:关注客观事实并忽视各种噪音是很重要的。

教学 6:當不同時間段的趨勢發生衝突時

Image
交易是複雜的,因為價格是不同時間段上價格活動疊加的波。 Charting on Tradingview Source of the idea 當短期,中期和長期時間框架的趨勢向同一方向移動時,整體而言價格趨勢是明確的。 另一方面,當不同時間段的趨勢相互對立時,价格盘整且價格趨勢難以預測。 過去兩天內,這發生在BTCUSD。 在短期到中期的時間範圍內(15分鐘 - > 2H),有多個超賣/支撐(藍色)信號,這表明了強有力的支持。 在長期時間範圍(169分鐘,4H),有熊(紅色)信號。 在339分鐘,有超買/阻力(黃色)信號。 在4H,678分鐘,有Bull Pullback(淺綠色)信號。 藍色和淺綠色显示多头力量,而紅色和黃色显示空方力量。这种彼此对立的多时间维度的模式反映了市場的盘整情況。 多空双方都相信自己这一方會贏。 因此,處理這種情況的政策是遠離交易,直到盘整被打破。 9 Seasons Rainbow Multiple Time Frames Pattern”給出的一种有用信號是超賣/支持(藍色) - >狂卖(紫紅色),表示出現向下破位的嘗試。如果它反轉,紫紅色變回藍色,表示突破失敗。 昨天有兩次嘗試突破,第一次失敗,而第二次成功。 有時,人們通過結合他們獲得的所有信息來做出判斷,包括他們的經驗,來自指標的信號,來自其他交易者的想法,新聞,甚至他們的情緒。在我最新的想法“BITCOIN GOT VALID SUPPORT,BULL可能測試4050抵抗力”中,我認為失敗的破位將導致重新測試4050阻力,這已被證明與實際價格走勢相反。這對我來說是一個教訓:關注客觀事實並忽視各種噪音是很重要的。

Tutorial 6: When Trends of Different Time Frames Conflict

Image
Trading is complected, because Price is superimposed wave of price activities on different time frames. Charting on Tradingview Source of the Idea When trends on short, medium and long term time frames move in the same direction, price trend is clear, as a whole. On the other hand, when trends on different time frames against each other, range happens and price trend is hard to predict. This happened within the past two days on BTCUSD . On short term to medium term time frames (15 minute -> 2H), there were multiple Oversold/Support (Blue) signals, which indicated strong support. On long term time frames (169 minute, 4H), there were Bear (Red) signals. On 339 minute, there was Overbought/Resistance (Yellow) signal. On 4H, 678 minute, there were Bull Pullback (Light Green) signal. Blue and light green is for Bull, while Red and Yellow is for Bear. The against-each-other pattern reflects the range situation of the market. Bull and Bear both believe their side will win

9 Seasons Rainbow - Multiple Time Frames Associated Price Wave Pattern Indicator

The indicator discovers profitable patterns by associating Price Season of multiple time frames. Full Name: 9 Seasons Rainbow - Multiple Time Frames Associated Price Wave Pattern Indicator This is redefined from “9 Seasons Rainbow Indicator PRO”, with clearer definition of 9 Seasons and user manual. Version: Invite-Only PRO Language: English Copyright: 2019 Indicator Location ---------- How to use the indicator ---------- Go through the manual and related ideas underneath or follow the tutorials list. Look through the profitable patterns and related cases, wait for or set alert for specific profitable pattern. ---------- Definition: 9 Seasons ---------- A life cycle of Price Wave is divided into 9 Seasons. Each time frame, from 5 minute to 1 month, has 9 seasons, Independent of each other: Bull (Green) Bull Pullback (Light Green): a pullback or retracement Resistance / Overbought (Yellow): a resistance area, may become a Top, or be broken through. Crazy

Indicator: SMA Serial for Crypto Day Trade Fixed Length SSCDTEN

Image
Crypto market is different from other financial markets  This indicator plot  SMA  series that fits Crypto,  esp   BTCUSD   ,  XBTUSD   Good for 5m - 1H time period for Day Trading.  Specific  SMA  can be toggle on/off  Charting by tradingview Source of the Indicator ---------- Française ----------  Le  marché de la crypto-monnaie est différent  des  autres marchés financiers  Cet indicateur série  SMA  qui correspond à Crypto-monnaie, en particulier  BTCUSD   ,  XBTUSD   Bon pour 5m - 1H période pour  le  day trading.  SMA  spécifique peut être activé / désactivé  ---------- 中文 ----------  加密货币市场与其他金融市场不同  该指标绘制了适合加密货币的SMA系列,特别是BTCUSD,XBTUSD  适合5分钟 - 1小时 日间交易时间段。  特定SMA可以打开/关闭  ----------日本語----------  暗号通貨市場は他の金融市場とは異なります  この指標は、暗号通貨、特にBTCUSD、XBTUSD用のSMAシリーズを描画します。  5分から1時間の取引期間に適しています。  特定のSMAをオン/オフにすることができます  ---------- Disclaim ----------  Before using this indicator, you acknowledge that you have read and accepted that this indicator is for research purpose only and it

見逃してはいけない:トレンド追跡モードはEOSUSDの急上昇を予測する

Image
9 Seasons Rainbow Indicator PRO 9シーズンレインボーインジケーター」を使った「トレンドフォローパターン」について教えてください。 今回は、それは完全に底掘削機として機能します。 Charting on Tradingview 出典 昨日、DOJIの前に、「トレンド追従モード」に基づいて9回目のシーズンの虹のインディケータ「Time to Buy」が警告を発しました。 トレンドフォローモード: 複数の時間枠で売られ過ぎ(青):15m、21m、30m、84m、2H  - 強力なサポートを意味し、調整は完了している可能性があります。 170m、4H、339m、8Hのクマ(赤): - 中程度の時間枠がクマの状況であることを意味する 11H、16H、23Hの強気相場調整(ライトグリーン) - 最大の時間枠は牛の背景です 要約:ビッグタイムフレームの牛の状況では、中期的なタイムフレームの調整はすぐに完了するので、今はビッグタイムフレームの「強気の傾向」に従うのに良い時期です。 昨日の分析: "EOSUSDは調整を完了しました。 https://www.tradingview.com/chart/EOSUSD/PXVTJnir-EOSUSD-Completed-Adjustment-Time-to-Long/ トレンド追跡モードを適用するいくつかの同様のEOSUSDの例: - 表示するにはチャートをスクロールしてください 20190312 06:30 20190311 19:00(売られ過ぎの青のレベルは少し弱いです) 20190304 16:00 20190302 22:00(一段階売られている - 青は少し弱い) 20190227 04:00 ----------免責事項---------- それは個人的な意見であり、投資取引のアドバイスを構成するものではありません。 ユーザーは独立した判断を下し、慎重に投資と取引のリスクを評価し、引き受けるべきです!

不再错过: 趋势跟随模式预测EOSUSD飙升

Image
这个教学观点是关于使用“9 Seasons Rainbow Indicator PRO” 的 “趋势跟随模式”。 这一次,它完美地充当了底部发掘机。 Chart on Tradingview 姊妹地址 昨天,在DOJI之前,9季彩虹指标 预警 “Time to Buy”, 基于“趋势跟随模式”已经形成的信号: 超卖(蓝色)在多个时间范围内:15m,21m,30m, 84m,2H - 意味着有力的支撑,调整可能已完成。 熊(红色)在170m,4H,339m,8H: - 意味着中等时间帧是熊的情境 牛市调整(浅绿色)在11H,16H,23H  - 意味着最大的时间框架是牛的背景 总结:在大时间框架牛的情境,中期时间框架调整快完成,所以现在是跟随大时间框架“牛市趋势”的好时机。 昨天的分析观点:" EOSUSD Completed Adjustment, Time to Long " 应用趋势跟踪模式的一些类似的EOSUSD实例: - 请滚动图表查看 20190312 06:30 20190311 19:00(一级超卖蓝色有点弱) 20190304 16:00 20190302 22:00(一级超卖 - 蓝色有点弱) 20190227 04:00 指标上一次预测坍塌:“比特币坍塌,正如九季彩虹指标在昨天所预警”  ---------- 免责声明 ---------- 仅为个人观点,不构成投资交易建议。 用户应独立判断,审慎评估并自负投资和交易风险!

Tutorial 5: Don't Miss It Next Time: Trend Following Pattern Predicted Crypto Pump

Image
This education idea is about "Trend Following Pattern" using "9 Seasons Rainbow Indicator PRO". This time, it serves as a BottomFinder perfectly. Yesterday, just before the Dogi, 9 Seasons Rainbow Indicator PRO indicated that a "Trend Following Pattern" had formed: Charting on Tradingview Source of the Idea OverSold(Blue) in multiple time frames: 15m, 21m,30m 84m, 2H - meaning strong support and the adjustment might completed. Bear(Red) in 170m, 4H, 339m, 8H: - meaning the medium time frames is Bear Context BullRest(Light Green) in 11H, 16H, 23H - meaning the big time frames is Bull Context -(need to check the last two on 30m) Summary: On big time frames Bull Context, medium time frames adjustment almost completes, so it is a good time to follow big time frames' Bull Trend. Some similar Instances for EOSUSD that Trend Following Pattern applied: - Please Scroll the chart to See 20190312 06:30 20190311 19:00 (Oversold-Blue in One 

BITCOIN TIENE UN APOYO VÁLIDO A LO LARGO DEL CANAL

Image
Bitcoin acaba de rebotar en el soporte tal como lo hice hace 2 días en la idea "Soporte, resistencia y canal ascendente de Bitcoin para la próxima semana". El canal ascendente se mantiene bastante bien, mientras que la resistencia superior se reduce un poco a 4000 USD (Bitfinex: BTCUSD). Se agrega una nueva línea de tendencia, que podría ser una nueva resistencia. Antes del rebote, OverSold (Azul) apareció en 30m y 42m, indicó el fuerte apoyo. Para comprender cómo se define OverSold en "9 Seasons Rainbow Indicator", y para probar DEMO en sus activos favoritos, Por favor revise los recursos de abajo. DISCLAIM Esta es solo una opinión personal y NO sirve para invertir NOR asesoramiento comercial. Tome sus propias decisiones, evalúe cuidadosamente los riesgos y sea responsable de sus propias inversiones y actividades comerciales. El inglés prevalecerá This is only a personal opinion and does NOT serve as investing NOR trading advice. Please make their

BITCOIN OBTENU UN SUPPORT VALIDE LE LONG DU CANAL PREDICTED

Image
Bitcoin vient juste de rebondir du support alors que je figurais il y a 2 jours dans l'idée "Support, résistance et canal ascendant de Bitcoin pour la semaine prochaine". Le canal ascendant est assez bien maintenu, tandis que la résistance supérieure est légèrement abaissée à 4000 USD (Bitfinex: BTCUSD). Une nouvelle ligne de tendance est ajoutée, qui pourrait être une nouvelle résistance. Avant le rebond, Oversold (Blue) est apparu dans les 30 m et 42 m, ce qui indique le fort soutien. Pour comprendre comment Oversold est défini dans "9 Seasons Rainbow Indicator" et pour essayer DEMO sur vos ressources préférées, S'il vous plaît vérifier les ressources ci-dessous. DISCLAIM Ce n’est qu’une opinion personnelle et ne sert PAS comme un conseil en investissement ou en trading. Veuillez prendre leurs propres décisions, évaluer attentivement les risques et assumer la responsabilité de vos propres activités d’investissement et de négociation.

Bitcoin은 상승 채널을 따라 효과적인 지원을 얻습니다.

Image
Bitcoin의 최근 반등은 Upside 채널의 유효성을 검증합니다. "Bitcoin의 현재 지원, 저항 및 상승 채널"에 대한 이전 견해를 참조하십시오.  위의 압력 수준은 4000usd (BITFINEX :  BTCUSD   )로 조정되며 새로운 추세선이 압력을 생성 할 수 있습니다.  30 분과 42 분의 과매비 (파란)는 리바운드 전에 조기 경고했다.  일중 거래를 준비하고 콜백이 안정된 후에 소량을 만듭니다.  "9 Seasons Rainbow Indicators"에서 "oversold (blue)"의 정의에 대해 궁금하거나 선호하는 거래에서 지표가 어떻게 작동하는지 알고 싶다면 아래 부록에 링크되어있는 자료를 참조하십시오.  ---------- 면책 조항 ----------  그것은 단지 개인적인 의견이며 투자 거래 자문을 구성하지 않습니다.  사용자는 독립적 인 판단을 내리고 조심스럽게 평가하고 투자 및 거래의 위험을 감수해야합니다!  영어가 우선한다.  ##################### DISCLAIM ###################  This is only a personal opinion and does NOT serve as investing NOR trading advice.  Please make their own decisions, carefully assess risks and be responsible for your own investing and trading activities. 

ビットコインは上昇チャネルに沿って効果的な支持を得ます

Image
最近のBitcoinの回復により、上昇チャネルの有効性が検証されました。以前の「Bitcoinの現在のサポート、抵抗、上昇傾向チャネル」の見解を参照してください。  上記の圧力レベルは4000usd(BITFINEX:BTCUSD)に調整されており、新しいトレンドラインによって圧力が発生する可能性があります。  30分と42分の売られ過ぎ(青)は、リバウンドの前に早期警告を出しました。  日中取引の準備をし、コールバックが安定した後に少量を作ります。  "9 Seasons Rainbow Indicators"の "売られすぎ(青)"の定義に興味がある場合、またはあなたのお気に入りの取引でインディケータがどのように機能するかを知りたい場合は、以下の付録にリンクされているリソースをご覧ください。  ----------免責事項----------  それは個人的な意見であり、投資取引のアドバイスを構成するものではありません。  ユーザーは独立した判断を下し、慎重に投資と取引のリスクを評価し、引き受けるべきです!  英語が優先するものとします  ##################### DISCLAIM ###################  This is only a personal opinion and does NOT serve as investing NOR trading advice.  Please make their own decisions, carefully assess risks and be responsible for your own investing and trading activities. 

比特币在上升渠道下沿获得有效支撑

Image
比特币刚刚的反弹验证了上升渠道的有效性,参见之前观点“比特币目前的支撑,阻力和上升通道”。 上方的压力位调整到4000usd(BITFINEX:BTCUSD), 一个新的趋势线可能形成压力。 在反弹前,30分钟和42分钟的超卖(蓝色)给出了提前的预警。 准备日内交易,在回调企稳后小量做多。  如果您好奇“超卖(蓝色)”在“九季彩虹指标”的定义,或者您想看看指标运用在您喜欢的交易品种的效果,请查阅下方附录链接的资源。  ---------- 免责声明 ----------  仅为个人观点,不构成投资交易建议。  用户应独立判断,审慎评估并自负投资和交易风险! 

BITCOIN GOT VALID SUPPORT ALONG CHANNEL PREDICTED

Image
Bitcoin just bounced from the support as I charted 2 days ago in the idea " Bitcoin's Support, Resistance & Ascending Channel for Next Week ". The Ascending Channel is maintained pretty well, while the upper Resistance is lowered a bit to 4000 USD (Bitfinex:BTCUSD). A new Resistant Trend Line is added, which might be a new Resistance. Charting by tradingview Sibling Page in Charting Platform Before the bounce, OverSold appeared in 30m & 42m, indicated the strong support. ##################### DISCLAIM ################### This is only a personal opinion and does NOT serve as investing NOR trading advice. Please make their own decisions, carefully assess risks and be responsible for your own investing and trading activities.

Tutorial 4: Right Shoulders Indicated Only in 5M Frame by 9 Seasons Rainbow

Image
5M is too small for most people, however, it provides important signals that bigger time frames does not. LTCUSD has formed two shoulders yesterday, which are indicated on 5M time frame by "9 Seasons Rainbow Indicator PRO". These OverBought (Yellow) signals helped me stop manually the long trade in Breakeven. Charting by tradingview Source of Education Idea 5m 7m Overbought(yellow) itself is not strong enough, but when combined with the big context: Overbought(yellow) or Bear(Red) in big time frames (>2H), Right Shoulders can be indicated. ##################### DISCLAIM ################### This is only a personal opinion and does NOT serve as investing NOR trading advice. Please make their own decisions, carefully assess risks and be responsible for your own investing and trading activities.

Tutorial 3: Why Do People Ignore the Foot Steps of a Huge Bear

Image
A DUMP just happened, as alerted in my last idea <<BITCOIN is Overbought, a big pullback may happen soon>> of yesterday. Not many people agreed with me. I have another education idea <<Yellow, the Color that Predicts Dump of Bitcoin>>, which listed all the Tops indicated by <<9 Seasons Rainbow Indicator>> since November 2018 in 15m time frame. Charting by tradingview Source of Education Idea Normally overbought is good time to take the profit; however, it could evolve to crazybought, which indicates kind of Breakout or a final bull run. While CrazyBought turns back to Overbought, it indicates Bull is exhausted again. When there are overbought in multiple time frames between 1H and 4H, for BITCOIN , if it is not a super Bull market as 2017, normally means Bull is becoming exhausted. A Good policy is to Short the new high, that is Amazing. Tips: 9 Seasons Definition in <<9 Seasons Rainbow Indicator>>: ---------- 9 Seas

Tutotial 2: BottomFinder: Long Signals of OverSold above Bull or BullRest

Image
This education idea uses "9 Seasons Rainbow Indicator" to discuss long trade signals based on specific scenario. The combinations of seasons on different time frames form patterns; some patterns have high probability of success for trading. "Long Signals of OverSold above Bull or BullRest Seasons" is one of the best signals, which serves as a bottom finder. Charting from tradingview Source of Education Idea OverSold on small time frame + Bull or BullRest on big time frames normally indicates a bottom. When the bottom is tested again and confirmed, it may be a good time for long trade. Instances: Please scroll to the time for details. 20190223 09:30 20190217 20:00 20190214 15:00 20190127 13:00 20190106 09:00 20190104 21:00 20181228 11:00 This post also use "Profitability Meter for Day Trading" to see the possible profit of the trades. ##################### DISCLAIM ################### This is only a personal opinion and does NO

Tutorial 1: Yellow, the Color that Predicts Dump of Bitcoin

Image
Bitcoin is famous for high volatility and all kinds of traps that happen at anytime. When a dump ended a bullish run, people got sucked. Is there a way to lock maximum profits from your existing long positions and to avoid opening new long positions before a dump?  Charting by  tradingview Link to Education Idea                                                                                              The solution is the color Yellow. Yellow represents OverBought, which is one of the seasons of market life cycle in "9 Seasons Rainbow Indicator". Let's have a look at two related seasons' definition: OverBought (Yellow): may have defined a top or resistance, can happen in range, evolves into CrazyBought (Lime) or Bear (Red). CrazyBought (Lime): going up in a high volatility , evolves into Bear (Red), OverBought (Yellow), or BullRest (Light Red). When OverBought (Yellow)appears, it indicates that Bull is encountering certain resistance and the speed of r