Posts

Showing posts with the label Education Idea

Tutorial 6: When Trends of Different Time Frames Conflict

Image
Trading is complected, because Price is superimposed wave of price activities on different time frames. Charting on Tradingview Source of the Idea When trends on short, medium and long term time frames move in the same direction, price trend is clear, as a whole. On the other hand, when trends on different time frames against each other, range happens and price trend is hard to predict. This happened within the past two days on BTCUSD . On short term to medium term time frames (15 minute -> 2H), there were multiple Oversold/Support (Blue) signals, which indicated strong support. On long term time frames (169 minute, 4H), there were Bear (Red) signals. On 339 minute, there was Overbought/Resistance (Yellow) signal. On 4H, 678 minute, there were Bull Pullback (Light Green) signal. Blue and light green is for Bull, while Red and Yellow is for Bear. The against-each-other pattern reflects the range situation of the market. Bull and Bear both believe their side will win...
Tutorial 5: Don't Miss It Next Time: Trend Following Pattern Predicted Crypto Pump

Image
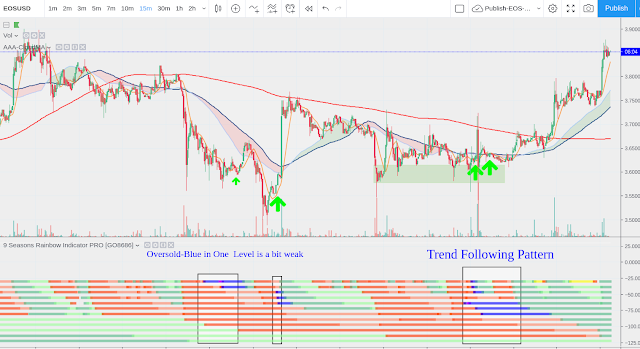
This education idea is about "Trend Following Pattern" using "9 Seasons Rainbow Indicator PRO". This time, it serves as a BottomFinder perfectly. Yesterday, just before the Dogi, 9 Seasons Rainbow Indicator PRO indicated that a "Trend Following Pattern" had formed: Charting on Tradingview Source of the Idea OverSold(Blue) in multiple time frames: 15m, 21m,30m 84m, 2H - meaning strong support and the adjustment might completed. Bear(Red) in 170m, 4H, 339m, 8H: - meaning the medium time frames is Bear Context BullRest(Light Green) in 11H, 16H, 23H - meaning the big time frames is Bull Context -(need to check the last two on 30m) Summary: On big time frames Bull Context, medium time frames adjustment almost completes, so it is a good time to follow big time frames' Bull Trend. Some similar Instances for EOSUSD that Trend Following Pattern applied: - Please Scroll the chart to See 20190312 06:30 20190311 19:00 (Oversold-Blue in One ...

Tutorial 4: Right Shoulders Indicated Only in 5M Frame by 9 Seasons Rainbow

Image
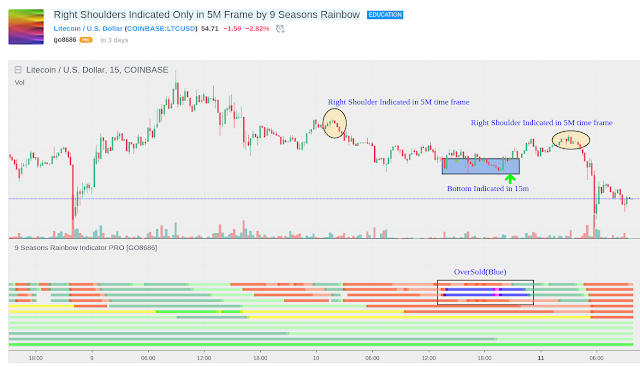
5M is too small for most people, however, it provides important signals that bigger time frames does not. LTCUSD has formed two shoulders yesterday, which are indicated on 5M time frame by "9 Seasons Rainbow Indicator PRO". These OverBought (Yellow) signals helped me stop manually the long trade in Breakeven. Charting by tradingview Source of Education Idea 5m 7m Overbought(yellow) itself is not strong enough, but when combined with the big context: Overbought(yellow) or Bear(Red) in big time frames (>2H), Right Shoulders can be indicated. ##################### DISCLAIM ################### This is only a personal opinion and does NOT serve as investing NOR trading advice. Please make their own decisions, carefully assess risks and be responsible for your own investing and trading activities.

Tutorial 3: Why Do People Ignore the Foot Steps of a Huge Bear

Image
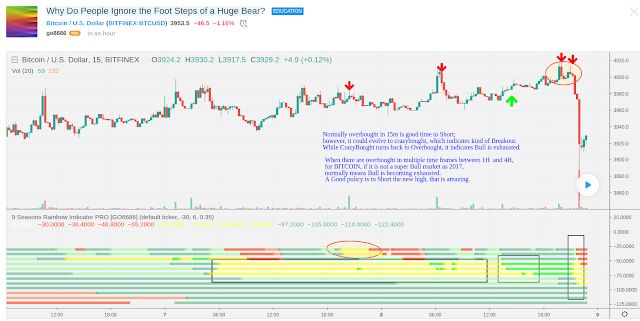
A DUMP just happened, as alerted in my last idea <<BITCOIN is Overbought, a big pullback may happen soon>> of yesterday. Not many people agreed with me. I have another education idea <<Yellow, the Color that Predicts Dump of Bitcoin>>, which listed all the Tops indicated by <<9 Seasons Rainbow Indicator>> since November 2018 in 15m time frame. Charting by tradingview Source of Education Idea Normally overbought is good time to take the profit; however, it could evolve to crazybought, which indicates kind of Breakout or a final bull run. While CrazyBought turns back to Overbought, it indicates Bull is exhausted again. When there are overbought in multiple time frames between 1H and 4H, for BITCOIN , if it is not a super Bull market as 2017, normally means Bull is becoming exhausted. A Good policy is to Short the new high, that is Amazing. Tips: 9 Seasons Definition in <<9 Seasons Rainbow Indicator>>: ---------- 9 Seas...

Tutotial 2: BottomFinder: Long Signals of OverSold above Bull or BullRest

Image
This education idea uses "9 Seasons Rainbow Indicator" to discuss long trade signals based on specific scenario. The combinations of seasons on different time frames form patterns; some patterns have high probability of success for trading. "Long Signals of OverSold above Bull or BullRest Seasons" is one of the best signals, which serves as a bottom finder. Charting from tradingview Source of Education Idea OverSold on small time frame + Bull or BullRest on big time frames normally indicates a bottom. When the bottom is tested again and confirmed, it may be a good time for long trade. Instances: Please scroll to the time for details. 20190223 09:30 20190217 20:00 20190214 15:00 20190127 13:00 20190106 09:00 20190104 21:00 20181228 11:00 This post also use "Profitability Meter for Day Trading" to see the possible profit of the trades. ##################### DISCLAIM ################### This is only a personal opinion and does NO...

Tutorial 1: Yellow, the Color that Predicts Dump of Bitcoin

Image
Bitcoin is famous for high volatility and all kinds of traps that happen at anytime. When a dump ended a bullish run, people got sucked. Is there a way to lock maximum profits from your existing long positions and to avoid opening new long positions before a dump?  Charting by  tradingview Link to Education Idea                                                                                              The solution is the color Yellow. Yellow represents OverBought, which is one of the seasons of market life cycle in "9 Seasons Rainbow Indicator". Let's have a look at two related seasons' definition: OverBought (Yellow): may have defined a top or resistance, can happen in range, evolves into CrazyBought (Lime) or Bear (Red). CrazyBou...