Posts

Showing posts with the label oversold

教程20190505:上证综指交易机会盘点2018年1月--2019年4月

图表平台TV 文章地址 本观点回顾了上证综指自2018年1月到2019年4月的重要交易机会。 使用的指标:九季彩虹多时间维度模式指标 (9 Seasons Rainbow Multiple Time Frames Pattern) 时间维度:30分钟 -》 23小时 关于指标的理论体系,概念定义,请查看 指标页面 下方中文部分: 需要免费试用指标,请私信指标作者。 交易机会时点,以及信号注解:请滚动图表查看详情。 2017-12-19 蓝色标志的支撑/超卖,经过两次回探测试,得以确认为底部 2018-02-05 死亡三角 2018-02-27 黄色高低配合:强信号 黄色:压力位,超买 2018-03-16 2018-03-22 绿色(牛)-》红色(熊) 市场基调:全红-熊 2018-04-09 蓝色:支撑/超卖 蓝色高低配合 2018-05-03 多维度蓝色, 高低配合:强信号 蓝色:超卖/支撑 经过两次回探测试,得以确认为底部 2018-05-23 多根黄色 + 背景红色:超买/压力位 + 熊市 2018-06-13 死亡三角 短暂的支撑被突破 蓝色-》紫色 2018-06-27 滑坡:支撑不断被向下突破 所以一出现蓝色(支撑,超卖)就开多头仓位是有风险的。 比较稳妥的方法:等到蓝色标识的支撑被确认有效后开第一个多头仓位。 后续的仓位可以等到18均线站稳在60均线上方,回调企稳后建立。 2018-07-12 2018-07-20 蓝色标志的支撑区域被确认 2018-08-01 死亡三角 2018-08-22 单个蓝色色带的信号比较弱。 最好多个蓝色,并且高低配合 蓝色:超卖 / 支撑 2018-09-18 蓝色/超卖/支撑,高低配合 2018-09-28 黄色:压力/超买 + 红色背景(熊) 空头仍然控制局面 反弹结束就应退场。 2018-10-19 超跌反弹:蓝色超卖 2018-10-30 回探测试之前蓝色定义的支撑 2018-11-19 黄色:超买/压力 + 蓝色基调:底部盘整,反弹结束,准备回探支撑 2018-11-30 回探支撑:蓝色高低配合 2018-12-19 蓝色-》紫色,向下突破支撑 紫色:狂卖 2019-0...
異なる期間の傾向が対立するとき

Image
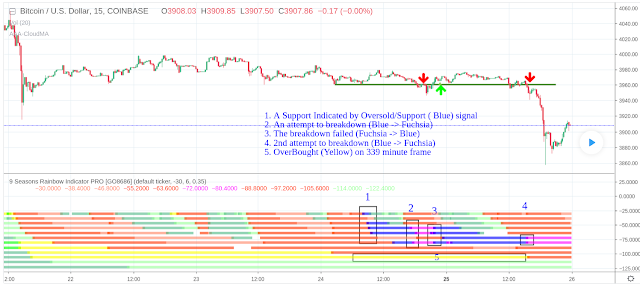
価格はさまざまな期間に重なる価格活動の波であるため、取引は複雑です。 charting on tradingview 短期、中期、および長期の時間枠の傾向が同じ方向に動く場合、全体的な価格の傾向は明らかです。 一方、異なる期間の傾向が互いに逆の場合、価格は統合されており、価格の傾向を予測するのは困難です。 これは過去2日間のBTCUSDで起こりました。 短期から中期(15分 - > 2時間)には、複数の売られ過ぎ/支持(青)のシグナルがあり、強い支持を示しています。 長期間(169分、4時間)には、弱(赤)の信号があります。 339分で、買われ過ぎ/抵抗(黄色)のシグナルがあります。 4時間678分に、Bull Pullback(薄緑色)信号があります。 青と薄緑色は長い電力を示し、赤と黄色は空の電力を示します。互いに対立する複数の時間ディメンションのこのパターンは、市場の統合を反映しています。長短双方が勝つと信じています。 したがって、この状況に対処するための方針は、統合が破られるまでトランザクションから離れることです。 「9 Seasons Rainbow Multiple Time Frames Pattern」によって与えられる有用な信号の1つは、売られ過ぎ/サポート(青) - >クレイジー(フクシア)です。反転すると、マゼンタが青色に戻り、飛躍的な失敗を示します。 昨日、私は2度突破しようとしました。初めて失敗し、2回目に成功しました。 経験、指標からのシグナル、他のトレーダーからのアイデア、ニュース、さらには感情さえも含めて、得られるすべての情報を組み合わせて判断を下すことがあります。昨日の私の意見では、「Bitcoinは小さな二重底を築き、4050年の圧力は再び長期的な課題に直面する可能性が高い」との見方を示しています。これは私にとっての教訓です。客観的事実に焦点を当て、あらゆる種類のノイズを無視することが重要です。

Tutorial 6: When Trends of Different Time Frames Conflict

Image
Trading is complected, because Price is superimposed wave of price activities on different time frames. Charting on Tradingview Source of the Idea When trends on short, medium and long term time frames move in the same direction, price trend is clear, as a whole. On the other hand, when trends on different time frames against each other, range happens and price trend is hard to predict. This happened within the past two days on BTCUSD . On short term to medium term time frames (15 minute -> 2H), there were multiple Oversold/Support (Blue) signals, which indicated strong support. On long term time frames (169 minute, 4H), there were Bear (Red) signals. On 339 minute, there was Overbought/Resistance (Yellow) signal. On 4H, 678 minute, there were Bull Pullback (Light Green) signal. Blue and light green is for Bull, while Red and Yellow is for Bear. The against-each-other pattern reflects the range situation of the market. Bull and Bear both believe their side will win...

Tutorial 5: Don't Miss It Next Time: Trend Following Pattern Predicted Crypto Pump

Image
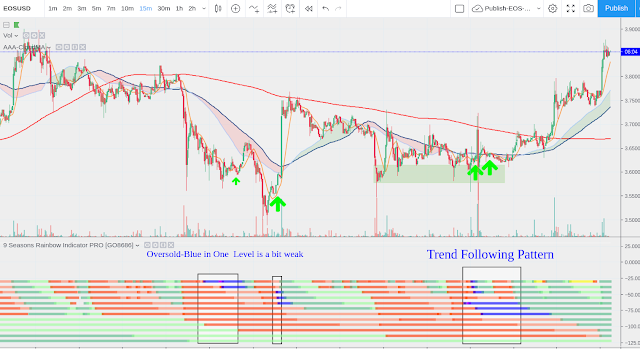
This education idea is about "Trend Following Pattern" using "9 Seasons Rainbow Indicator PRO". This time, it serves as a BottomFinder perfectly. Yesterday, just before the Dogi, 9 Seasons Rainbow Indicator PRO indicated that a "Trend Following Pattern" had formed: Charting on Tradingview Source of the Idea OverSold(Blue) in multiple time frames: 15m, 21m,30m 84m, 2H - meaning strong support and the adjustment might completed. Bear(Red) in 170m, 4H, 339m, 8H: - meaning the medium time frames is Bear Context BullRest(Light Green) in 11H, 16H, 23H - meaning the big time frames is Bull Context -(need to check the last two on 30m) Summary: On big time frames Bull Context, medium time frames adjustment almost completes, so it is a good time to follow big time frames' Bull Trend. Some similar Instances for EOSUSD that Trend Following Pattern applied: - Please Scroll the chart to See 20190312 06:30 20190311 19:00 (Oversold-Blue in One ...

Tutotial 2: BottomFinder: Long Signals of OverSold above Bull or BullRest

Image
This education idea uses "9 Seasons Rainbow Indicator" to discuss long trade signals based on specific scenario. The combinations of seasons on different time frames form patterns; some patterns have high probability of success for trading. "Long Signals of OverSold above Bull or BullRest Seasons" is one of the best signals, which serves as a bottom finder. Charting from tradingview Source of Education Idea OverSold on small time frame + Bull or BullRest on big time frames normally indicates a bottom. When the bottom is tested again and confirmed, it may be a good time for long trade. Instances: Please scroll to the time for details. 20190223 09:30 20190217 20:00 20190214 15:00 20190127 13:00 20190106 09:00 20190104 21:00 20181228 11:00 This post also use "Profitability Meter for Day Trading" to see the possible profit of the trades. ##################### DISCLAIM ################### This is only a personal opinion and does NO...