Posts

Showing posts with the label technical indicator

Indicator: SMA Serial for Crypto Day Trade Fixed Length SSCDTEN
Image
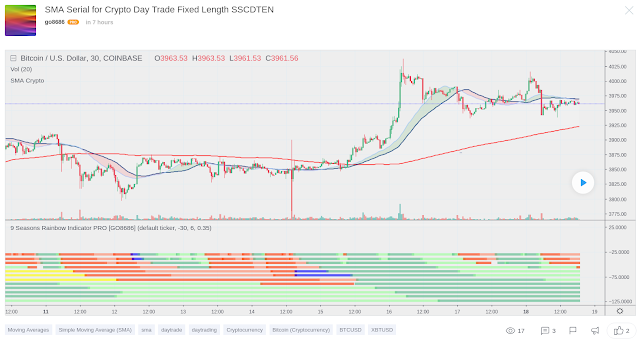
Crypto market is different from other financial markets  This indicator plot  SMA  series that fits Crypto,  esp   BTCUSD   ,  XBTUSD   Good for 5m - 1H time period for Day Trading.  Specific  SMA  can be toggle on/off  Charting by tradingview Source of the Indicator ---------- Française ----------  Le  marché de la crypto-monnaie est différent  des  autres marchés financiers  Cet indicateur série  SMA  qui correspond à Crypto-monnaie, en particulier  BTCUSD   ,  XBTUSD   Bon pour 5m - 1H période pour  le  day trading.  SMA  spécifique peut être activé / désactivé  ---------- 中文 ----------  加密货币市场与其他金融市场不同  该指标绘制了适合加密货币的SMA系列,特别是BTCUSD,XBTUSD  适合5分钟 - 1小时 日间交易时间段。  特定SMA可以打开/关闭  ----------日本語----------  暗号通貨市場は他の金融市場とは異なります  この指標は、暗号通貨、特にBTCUSD、XBTUSD用のSMAシリーズを描画します。  5分から1時間の取引期間に適しています。  特定のSM...
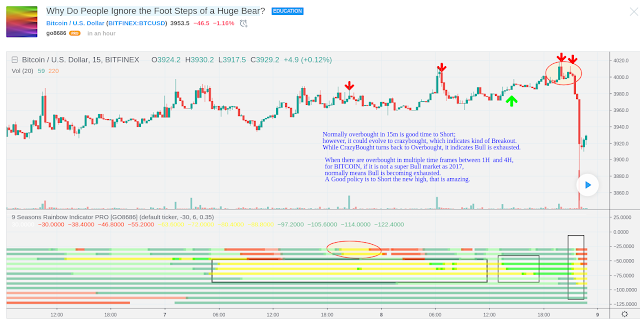
Tutorial 3: Why Do People Ignore the Foot Steps of a Huge Bear

Image
A DUMP just happened, as alerted in my last idea <<BITCOIN is Overbought, a big pullback may happen soon>> of yesterday. Not many people agreed with me. I have another education idea <<Yellow, the Color that Predicts Dump of Bitcoin>>, which listed all the Tops indicated by <<9 Seasons Rainbow Indicator>> since November 2018 in 15m time frame. Charting by tradingview Source of Education Idea Normally overbought is good time to take the profit; however, it could evolve to crazybought, which indicates kind of Breakout or a final bull run. While CrazyBought turns back to Overbought, it indicates Bull is exhausted again. When there are overbought in multiple time frames between 1H and 4H, for BITCOIN , if it is not a super Bull market as 2017, normally means Bull is becoming exhausted. A Good policy is to Short the new high, that is Amazing. Tips: 9 Seasons Definition in <<9 Seasons Rainbow Indicator>>: ---------- 9 Seas...

Tutotial 2: BottomFinder: Long Signals of OverSold above Bull or BullRest

Image
This education idea uses "9 Seasons Rainbow Indicator" to discuss long trade signals based on specific scenario. The combinations of seasons on different time frames form patterns; some patterns have high probability of success for trading. "Long Signals of OverSold above Bull or BullRest Seasons" is one of the best signals, which serves as a bottom finder. Charting from tradingview Source of Education Idea OverSold on small time frame + Bull or BullRest on big time frames normally indicates a bottom. When the bottom is tested again and confirmed, it may be a good time for long trade. Instances: Please scroll to the time for details. 20190223 09:30 20190217 20:00 20190214 15:00 20190127 13:00 20190106 09:00 20190104 21:00 20181228 11:00 This post also use "Profitability Meter for Day Trading" to see the possible profit of the trades. ##################### DISCLAIM ################### This is only a personal opinion and does NO...

Tutorial 1: Yellow, the Color that Predicts Dump of Bitcoin

Image
Bitcoin is famous for high volatility and all kinds of traps that happen at anytime. When a dump ended a bullish run, people got sucked. Is there a way to lock maximum profits from your existing long positions and to avoid opening new long positions before a dump?  Charting by  tradingview Link to Education Idea                                                                                              The solution is the color Yellow. Yellow represents OverBought, which is one of the seasons of market life cycle in "9 Seasons Rainbow Indicator". Let's have a look at two related seasons' definition: OverBought (Yellow): may have defined a top or resistance, can happen in range, evolves into CrazyBought (Lime) or Bear (Red). CrazyBou...