Posts

Showing posts with the label price dump

QU'EST-CE QUE CRAZY ACHETÉ (CHAUX)?

Image
Le surachat est bien connu des commerçants. Mais, qu'est-ce que "Crazy Bought"? Auparavant, il était difficile d'expliquer et de laisser les gens comprendre "Crazy Bought". Après deux jours de pompage et de vidage, cela devrait être plus facile maintenant. charting on tradingview English FR Crazy Bought est un nouveau terme défini dans l'indicateur "9 Seasons Rainbow Multiple Time Frames Pattern", qui est l'une des 9 saisons: Bull (vert), Bull Pullback (vert clair), Résistance / Sur achat (Jaune), Crazy Bought (Lime), Neutre (Blanc) , Ours (rouge), Bear Bounce (rouge clair), Soutien / Survente (bleu), Crazy vendu (Fuchsia). Définition: Achat fou (citron vert): Le prix monte avec une forte volatilité, pourrait être une évasion valide, ou un piège à taureau. Définition: Résistance / surachat (Jaune): une zone de résistance pouvant devenir un sommet ou être percée. Evolution de Crazy Bought (Lime): Lorsque la résistance est d...
マッドバイとは何ですか?

Image
買われ過ぎはトレーダーにはよく知られています。 しかし、「クレイジーバイ」とは一体何でしょうか。 これまでは、「クレイジーな購入」を説明して理解させることは困難でした。 2日間の急上昇と小さな滝の後、それは今もっと楽になるでしょう。 charting on tradingview Source English ソース 買いは「9 Seasons Rainbow Multiple Time Frames Pattern」指標で定義されている新しい用語で、9つの季節のうちの1つです:牛(緑色)、牛のリトレースメント(薄い緑色)、圧力/買われ過ぎ(黄色)、狂牛病(明るい緑色)、中立(白色) )、ベア(赤)、バウンス(淡い赤)、サポート/売られ過ぎ(青)、マッドセル(紫)。 定義:マッドバイ(明るい緑色):価格が高ボラティリティで上昇する、効果的なブレークスルー、または長い罠かもしれません。 定義:圧力/買われ過ぎ(黄色):圧力ゾーンが上になるか壊れている可能性があります。 マッドバイの進化(明るい緑色): 圧力ゾーンが破られると、圧力/買われ過ぎ(黄色)は気が狂います(薄緑色)。 価格が範囲を超えている場合、これは成功した画期的な、明るい緑色の拡張機能です。 価格が新しいレベルまで上昇してそこに留まると、マッドバイ(明るい緑色)は牛のリトレースメント(薄い緑色)になります。 価格が範囲内に戻った場合、これは失敗して買わず(明るい緑色)、買われ過ぎ(黄色)に戻ります。 マッドバイ(ブライトグリーン)シグナルの価値: 狂った買い(明るい緑色)が最短時間で表示される場合は、もっとすぐにやることを検討してください。 マッドバイ(明るい緑色)が中または長期の時間帯に表示される場合は、マルチシグナルの短時間のディメンションを待つか、リボンが緑色になるか、または従来のMACD、RSI、STOCHASTICなどを使用してください。 マッドバイ(明るい緑色)が黄色に変わったら、ロングポジションを閉じるかショートします。 単色バンドの明るい緑色は弱い信号であり、特定のパターンを持つ明るい緑色は有益な取引の可能性が高いです。 (パターンに関する他のチュートリアルを参照してください) 停止設定:水平方向のキャビネットの上部境界の下に停止を設...

Tutorial 3: Why Do People Ignore the Foot Steps of a Huge Bear

Image
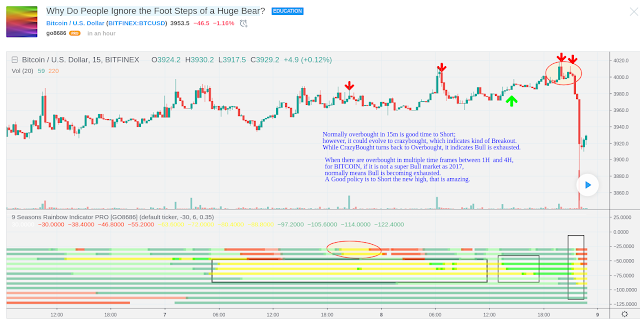
A DUMP just happened, as alerted in my last idea <<BITCOIN is Overbought, a big pullback may happen soon>> of yesterday. Not many people agreed with me. I have another education idea <<Yellow, the Color that Predicts Dump of Bitcoin>>, which listed all the Tops indicated by <<9 Seasons Rainbow Indicator>> since November 2018 in 15m time frame. Charting by tradingview Source of Education Idea Normally overbought is good time to take the profit; however, it could evolve to crazybought, which indicates kind of Breakout or a final bull run. While CrazyBought turns back to Overbought, it indicates Bull is exhausted again. When there are overbought in multiple time frames between 1H and 4H, for BITCOIN , if it is not a super Bull market as 2017, normally means Bull is becoming exhausted. A Good policy is to Short the new high, that is Amazing. Tips: 9 Seasons Definition in <<9 Seasons Rainbow Indicator>>: ---------- 9 Seas...

Tutorial 1: Yellow, the Color that Predicts Dump of Bitcoin

Image
Bitcoin is famous for high volatility and all kinds of traps that happen at anytime. When a dump ended a bullish run, people got sucked. Is there a way to lock maximum profits from your existing long positions and to avoid opening new long positions before a dump?  Charting by  tradingview Link to Education Idea                                                                                              The solution is the color Yellow. Yellow represents OverBought, which is one of the seasons of market life cycle in "9 Seasons Rainbow Indicator". Let's have a look at two related seasons' definition: OverBought (Yellow): may have defined a top or resistance, can happen in range, evolves into CrazyBought (Lime) or Bear (Red). CrazyBou...