Posts

Showing posts with the label overbought

教程20190505:上证综指交易机会盘点2018年1月--2019年4月

图表平台TV 文章地址 本观点回顾了上证综指自2018年1月到2019年4月的重要交易机会。 使用的指标:九季彩虹多时间维度模式指标 (9 Seasons Rainbow Multiple Time Frames Pattern) 时间维度:30分钟 -》 23小时 关于指标的理论体系,概念定义,请查看 指标页面 下方中文部分: 需要免费试用指标,请私信指标作者。 交易机会时点,以及信号注解:请滚动图表查看详情。 2017-12-19 蓝色标志的支撑/超卖,经过两次回探测试,得以确认为底部 2018-02-05 死亡三角 2018-02-27 黄色高低配合:强信号 黄色:压力位,超买 2018-03-16 2018-03-22 绿色(牛)-》红色(熊) 市场基调:全红-熊 2018-04-09 蓝色:支撑/超卖 蓝色高低配合 2018-05-03 多维度蓝色, 高低配合:强信号 蓝色:超卖/支撑 经过两次回探测试,得以确认为底部 2018-05-23 多根黄色 + 背景红色:超买/压力位 + 熊市 2018-06-13 死亡三角 短暂的支撑被突破 蓝色-》紫色 2018-06-27 滑坡:支撑不断被向下突破 所以一出现蓝色(支撑,超卖)就开多头仓位是有风险的。 比较稳妥的方法:等到蓝色标识的支撑被确认有效后开第一个多头仓位。 后续的仓位可以等到18均线站稳在60均线上方,回调企稳后建立。 2018-07-12 2018-07-20 蓝色标志的支撑区域被确认 2018-08-01 死亡三角 2018-08-22 单个蓝色色带的信号比较弱。 最好多个蓝色,并且高低配合 蓝色:超卖 / 支撑 2018-09-18 蓝色/超卖/支撑,高低配合 2018-09-28 黄色:压力/超买 + 红色背景(熊) 空头仍然控制局面 反弹结束就应退场。 2018-10-19 超跌反弹:蓝色超卖 2018-10-30 回探测试之前蓝色定义的支撑 2018-11-19 黄色:超买/压力 + 蓝色基调:底部盘整,反弹结束,准备回探支撑 2018-11-30 回探支撑:蓝色高低配合 2018-12-19 蓝色-》紫色,向下突破支撑 紫色:狂卖 2019-0...

QU'EST-CE QUE CRAZY ACHETÉ (CHAUX)?

Image
Le surachat est bien connu des commerçants. Mais, qu'est-ce que "Crazy Bought"? Auparavant, il était difficile d'expliquer et de laisser les gens comprendre "Crazy Bought". Après deux jours de pompage et de vidage, cela devrait être plus facile maintenant. charting on tradingview English FR Crazy Bought est un nouveau terme défini dans l'indicateur "9 Seasons Rainbow Multiple Time Frames Pattern", qui est l'une des 9 saisons: Bull (vert), Bull Pullback (vert clair), Résistance / Sur achat (Jaune), Crazy Bought (Lime), Neutre (Blanc) , Ours (rouge), Bear Bounce (rouge clair), Soutien / Survente (bleu), Crazy vendu (Fuchsia). Définition: Achat fou (citron vert): Le prix monte avec une forte volatilité, pourrait être une évasion valide, ou un piège à taureau. Définition: Résistance / surachat (Jaune): une zone de résistance pouvant devenir un sommet ou être percée. Evolution de Crazy Bought (Lime): Lorsque la résistance est d...

マッドバイとは何ですか?

Image
買われ過ぎはトレーダーにはよく知られています。 しかし、「クレイジーバイ」とは一体何でしょうか。 これまでは、「クレイジーな購入」を説明して理解させることは困難でした。 2日間の急上昇と小さな滝の後、それは今もっと楽になるでしょう。 charting on tradingview Source English ソース 買いは「9 Seasons Rainbow Multiple Time Frames Pattern」指標で定義されている新しい用語で、9つの季節のうちの1つです:牛(緑色)、牛のリトレースメント(薄い緑色)、圧力/買われ過ぎ(黄色)、狂牛病(明るい緑色)、中立(白色) )、ベア(赤)、バウンス(淡い赤)、サポート/売られ過ぎ(青)、マッドセル(紫)。 定義:マッドバイ(明るい緑色):価格が高ボラティリティで上昇する、効果的なブレークスルー、または長い罠かもしれません。 定義:圧力/買われ過ぎ(黄色):圧力ゾーンが上になるか壊れている可能性があります。 マッドバイの進化(明るい緑色): 圧力ゾーンが破られると、圧力/買われ過ぎ(黄色)は気が狂います(薄緑色)。 価格が範囲を超えている場合、これは成功した画期的な、明るい緑色の拡張機能です。 価格が新しいレベルまで上昇してそこに留まると、マッドバイ(明るい緑色)は牛のリトレースメント(薄い緑色)になります。 価格が範囲内に戻った場合、これは失敗して買わず(明るい緑色)、買われ過ぎ(黄色)に戻ります。 マッドバイ(ブライトグリーン)シグナルの価値: 狂った買い(明るい緑色)が最短時間で表示される場合は、もっとすぐにやることを検討してください。 マッドバイ(明るい緑色)が中または長期の時間帯に表示される場合は、マルチシグナルの短時間のディメンションを待つか、リボンが緑色になるか、または従来のMACD、RSI、STOCHASTICなどを使用してください。 マッドバイ(明るい緑色)が黄色に変わったら、ロングポジションを閉じるかショートします。 単色バンドの明るい緑色は弱い信号であり、特定のパターンを持つ明るい緑色は有益な取引の可能性が高いです。 (パターンに関する他のチュートリアルを参照してください) 停止設定:水平方向のキャビネットの上部境界の下に停止を設...

狂买是个什么东东?

Image
超买是交易者所熟知的。 但是,究竟什么是“狂买”? 以前,很难解释,让人们理解“狂买”。 经过两天的暴涨和小瀑布,现在应该更容易了。 charting on tradingview Source English 中文原文 狂买是“9季彩虹9 Seasons Rainbow Multiple Time Frames Pattern”指标中定义的新术语,是九季之一:牛(绿色),牛回撤(浅绿色),压力/超买(黄色),狂买 ( 亮绿),中性(白色),熊(红色),熊反弹(浅红色),支撑/超卖(蓝色),狂卖(紫红色)。 定义:狂买(亮绿):价格在高波动中上涨,可能是一个有效的突破,或者是一个多头陷阱。 定义:压力/超买(黄色):压力区域,可能成为顶部,或被突破。 狂买(亮绿)的演变: 当压力区被突破时,压力/超买(黄色)成为狂买(亮绿); 当价格保持在范围区域之上时,这是一个成功的突破,亮绿延伸; 当价格上涨到一个新的水平并停留在那里时,狂买(亮绿)成为牛回撤(浅绿色); 当价格回落到区间范围内时,这是一个失败的突破,狂买(亮绿)转回超买(黄色)。 狂买(亮绿)信号的价值: 当狂买(亮绿)出现在最短的时间维度上时,可以考虑马上做多。 当狂买(亮绿)出现在中期或长期时间范围内时,等待短时间维度的做多信号,其色带变为绿色,或使用传统的MACD,RSI,STOCHASTIC等。 当狂买(亮绿)变为黄色,关闭多头头寸或做空。 单色带中的亮绿是弱信号,具有特定模式的亮绿才具有获利交易的高概率。 (请参阅其他有关模式的教程) 停止设置:在横盘箱体的上边界下设置停止,留出一段距离。 市场很复杂,高风险伴随高回报。 (90%的时间) 压力/超买(黄色)通常意味着多头在该时间框架内耗尽,因此做空是合理的。 然而,一些隐藏的大鳄可以突然操纵/影响价格,尤其是在小时间维度。当依据压力/超买(黄色)信号开一个空头头寸时,如果黄色成为亮绿,应关闭空头头寸。 狂买(亮绿)通常意味着突破,所以做多是合理的; 然而,突破可能会失败,所以当亮绿反转为黄色时,关闭多头头寸。 有关其他8季的详细信息,请参阅指标页面: https://www.tradingview.com/scrip...

Tutorial 6: WHAT ON EARTH IS CRAZY BOUGHT (LIME)?

Image
Overbought is well known by traders. But, what on earth is "Crazy Bought"? Before, it is hard to explain and let people understand "Crazy Bought". After two days' pump, it should be easier now. Charting by tradingview Source: Crazy Bought is a new term defined in "9 Seasons Rainbow Multiple Time Frames Pattern" Indicator, which is one of the 9 Seasons: Bull (Green), Bull Pullback (Light Green), Resistance / Overbought (Yellow), Crazy Bought (Lime), Neutral (White), Bear (Red) , Bear Bounce (Light Red), Support / Oversold (Blue), Crazy Sold (Fuchsia). Definition: Crazy Bought (Lime): Price is going up in a high volatility , could be a valid breakout, or a Bull Trap. Definition: Resistance / Overbought (Yellow): a resistance area , may become a Top, or be broken through. Evolution of Crazy Bought(Lime): [*]When the resistance is broken through, Resistance / Overbought (Yellow) becomes Crazy Bought (Lime); [*]When the price stays above...

異なる期間の傾向が対立するとき

Image
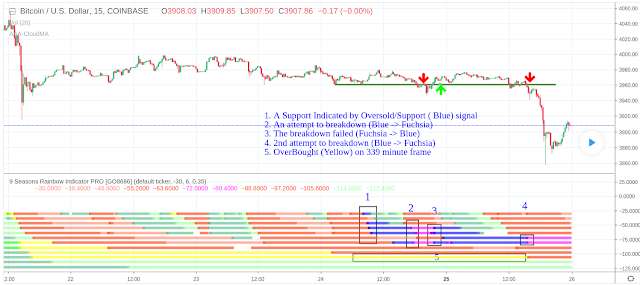
価格はさまざまな期間に重なる価格活動の波であるため、取引は複雑です。 charting on tradingview 短期、中期、および長期の時間枠の傾向が同じ方向に動く場合、全体的な価格の傾向は明らかです。 一方、異なる期間の傾向が互いに逆の場合、価格は統合されており、価格の傾向を予測するのは困難です。 これは過去2日間のBTCUSDで起こりました。 短期から中期(15分 - > 2時間)には、複数の売られ過ぎ/支持(青)のシグナルがあり、強い支持を示しています。 長期間(169分、4時間)には、弱(赤)の信号があります。 339分で、買われ過ぎ/抵抗(黄色)のシグナルがあります。 4時間678分に、Bull Pullback(薄緑色)信号があります。 青と薄緑色は長い電力を示し、赤と黄色は空の電力を示します。互いに対立する複数の時間ディメンションのこのパターンは、市場の統合を反映しています。長短双方が勝つと信じています。 したがって、この状況に対処するための方針は、統合が破られるまでトランザクションから離れることです。 「9 Seasons Rainbow Multiple Time Frames Pattern」によって与えられる有用な信号の1つは、売られ過ぎ/サポート(青) - >クレイジー(フクシア)です。反転すると、マゼンタが青色に戻り、飛躍的な失敗を示します。 昨日、私は2度突破しようとしました。初めて失敗し、2回目に成功しました。 経験、指標からのシグナル、他のトレーダーからのアイデア、ニュース、さらには感情さえも含めて、得られるすべての情報を組み合わせて判断を下すことがあります。昨日の私の意見では、「Bitcoinは小さな二重底を築き、4050年の圧力は再び長期的な課題に直面する可能性が高い」との見方を示しています。これは私にとっての教訓です。客観的事実に焦点を当て、あらゆる種類のノイズを無視することが重要です。

Tutorial 6: When Trends of Different Time Frames Conflict

Image
Trading is complected, because Price is superimposed wave of price activities on different time frames. Charting on Tradingview Source of the Idea When trends on short, medium and long term time frames move in the same direction, price trend is clear, as a whole. On the other hand, when trends on different time frames against each other, range happens and price trend is hard to predict. This happened within the past two days on BTCUSD . On short term to medium term time frames (15 minute -> 2H), there were multiple Oversold/Support (Blue) signals, which indicated strong support. On long term time frames (169 minute, 4H), there were Bear (Red) signals. On 339 minute, there was Overbought/Resistance (Yellow) signal. On 4H, 678 minute, there were Bull Pullback (Light Green) signal. Blue and light green is for Bull, while Red and Yellow is for Bear. The against-each-other pattern reflects the range situation of the market. Bull and Bear both believe their side will win...

Tutorial 4: Right Shoulders Indicated Only in 5M Frame by 9 Seasons Rainbow

Image
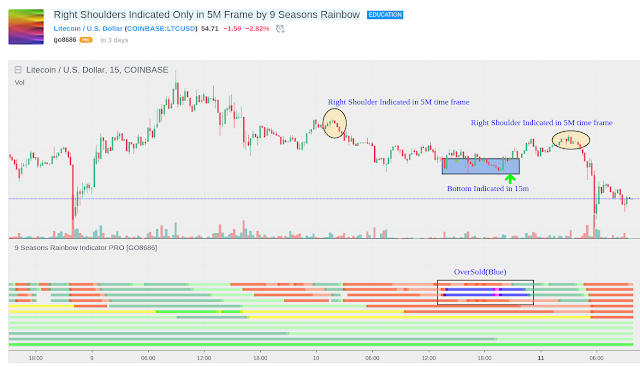
5M is too small for most people, however, it provides important signals that bigger time frames does not. LTCUSD has formed two shoulders yesterday, which are indicated on 5M time frame by "9 Seasons Rainbow Indicator PRO". These OverBought (Yellow) signals helped me stop manually the long trade in Breakeven. Charting by tradingview Source of Education Idea 5m 7m Overbought(yellow) itself is not strong enough, but when combined with the big context: Overbought(yellow) or Bear(Red) in big time frames (>2H), Right Shoulders can be indicated. ##################### DISCLAIM ################### This is only a personal opinion and does NOT serve as investing NOR trading advice. Please make their own decisions, carefully assess risks and be responsible for your own investing and trading activities.

Tutorial 3: Why Do People Ignore the Foot Steps of a Huge Bear

Image
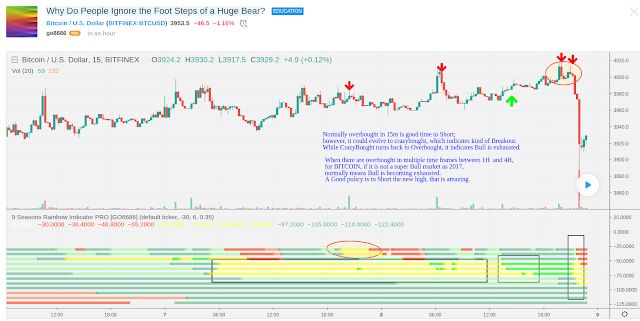
A DUMP just happened, as alerted in my last idea <<BITCOIN is Overbought, a big pullback may happen soon>> of yesterday. Not many people agreed with me. I have another education idea <<Yellow, the Color that Predicts Dump of Bitcoin>>, which listed all the Tops indicated by <<9 Seasons Rainbow Indicator>> since November 2018 in 15m time frame. Charting by tradingview Source of Education Idea Normally overbought is good time to take the profit; however, it could evolve to crazybought, which indicates kind of Breakout or a final bull run. While CrazyBought turns back to Overbought, it indicates Bull is exhausted again. When there are overbought in multiple time frames between 1H and 4H, for BITCOIN , if it is not a super Bull market as 2017, normally means Bull is becoming exhausted. A Good policy is to Short the new high, that is Amazing. Tips: 9 Seasons Definition in <<9 Seasons Rainbow Indicator>>: ---------- 9 Seas...

Tutorial 1: Yellow, the Color that Predicts Dump of Bitcoin

Image
Bitcoin is famous for high volatility and all kinds of traps that happen at anytime. When a dump ended a bullish run, people got sucked. Is there a way to lock maximum profits from your existing long positions and to avoid opening new long positions before a dump?  Charting by  tradingview Link to Education Idea                                                                                              The solution is the color Yellow. Yellow represents OverBought, which is one of the seasons of market life cycle in "9 Seasons Rainbow Indicator". Let's have a look at two related seasons' definition: OverBought (Yellow): may have defined a top or resistance, can happen in range, evolves into CrazyBought (Lime) or Bear (Red). CrazyBou...