Posts

Showing posts with the label multiple time frames indicator

比特币行情数字加密货币走势20201212 2XEM NewEconomyMovement突破分析

Image

九季彩虹交易指标的季节定义:黄色和亮绿色

Image
本视频介绍了黄色和亮绿色的定义,演变,可能的交易时机。分析基于近期的比特币(BITCOIN)兑美元的行情走势,以及上证指数和标准普尔500的价格图表。分析主要基于15分钟-60分钟图表的短线对冲交易,解决了黄色和亮绿色是什么,为什么和怎么用来做多做空交易的问题。 欢迎联系指标作者要求免费试用 九季彩虹交易指标图表平台:http://bit.ly/chartingplatform 我使用的虚拟货币交易所:http://bit.ly/cryptoexchangeIuse 蓝色-紫色:https://www.youtube.com/watch?v=yyqf4stoR7o 黄色和亮绿色是九季彩虹指标定义的九个价格季节中的两种,标示了价格上涨过程中遭遇阻力和突破阻力的两个不同阶段。蓝色和紫色的定义有助于分析预测上涨行情的阻力,回调,反转,破位等市场趋势。 九季彩虹交易指标(9 Seasons Rainbow Multiple Time Frames Pattern) 适用于数字加密货币,外汇,黄金,石油,股票等交易资产的趋势走势预测分析。 ------------------------风险提示----------------------- 在观看本视频和本频道内容之前,用户认可已经完全了解和接受: 本视频, 本频道的内容,以及介绍和链接的所有资源,包括但不限于: 视频内容,文字描述,交易指标,工具,交易平台,网站,博客,电子邮件,评论,问题解答等资源,仅为个人观点,仅供研究,测试和模拟交易目的。不提供任何赢利的确定性,不构成投资交易建议。 用户如果将上述内容用于真实交易或者投资,需要自行承担所有风险! ----------------Charting on tradingview----------------

比特幣下行通道交易策略-2019年七月

Image
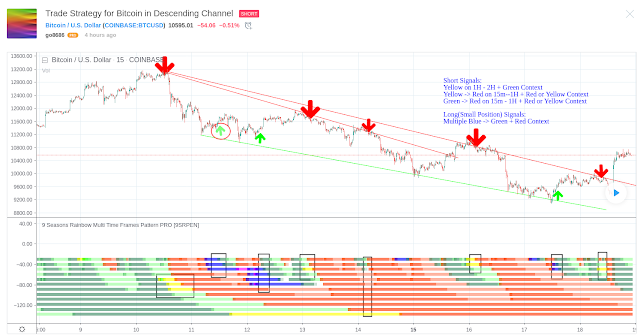
charting by Tradingview 交易品種 :  Bitcoin   ,  BTCUSD   ,  XBTUSD   市場背景: 下行通道  時間維度/周期: 15m - 11H  放空信號  Green->Red on 15m-30m + Yellow on 1H - 2H + Green Context  Yellow -> Red on 15m--1H + Red or Yellow Context  Green -> Red on 15m - 1H + Red or Yellow Context  靠近通道上沿  做多(小倉位)信號  多個 Blue -> Green + Red 背景  靠近通道下沿  交易計劃案例:  做多反彈:目標到達  做空反彈結束:目標到達 ---------- 免責聲明 ----------  本觀點僅為個人觀點,不構成投資交易建議。  用戶應獨立判斷,審慎評估並自負投資和交易風險!

Trade Strategy for Bitcoin in Descending Channel

Image
charting by tradingview Symbol:  Bitcoin   ,  BTCUSD   ,  XBTUSD   Context:  Descending Channel   Charting Timeframe: 15m - 11H  Short Signals:  Green->Red on 15m-30m + Yellow on 1H - 2H + Green Context  Yellow -> Red on 15m--1H + Red or Yellow Context  Green -> Red on 15m - 1H + Red or Yellow Context  Zone near upper border of the  Descending Channel   Long(Small Position) Signals:  Multiple Blue -> Green + Red Context  Zone near lower border of the  Descending Channel   Trade Setup Examples  Long trade a bounce: Target Reached  Short the end of a bounce: Target Reached  

Tuto 6: Is Divergence the King or Queen of Crypto Technical Analysis?

Image
Divergence is one of the best technical analysis theories. Although not 100%, a very high probability of profitability is well known.  tradingview Source of the article This idea lists most of the instances of divergence on BTCUSD (Coinbase) since $19892 summit of December 2017 on 2H interval.  Indicators used:  RSI  MACD  9 Seasons Rainbow Multiple Time Frames Pattern PRO  Base Time Frame: 2H, most upper ribbon of "9 Seasons Rainbow"  Longest Time Frame: 90H (3D + 18H), most lower ribbon of "9 Seasons Rainbow"  Instances of Bullish Divergences (Green Arrows)  29 instances, probability of profitability > 85%  Signals:  Blue ascending arrows in RSI & MACD  Blue Ribbons in "9 Seasons Rainbow"  Instances of Bearish Divergences (Red Arrows)  17 instances, probability of profitability > 90%  Signals:  Yellow descending arrows in RSI & MACD...

QU'EST-CE QUE CRAZY ACHETÉ (CHAUX)?

Image
Le surachat est bien connu des commerçants. Mais, qu'est-ce que "Crazy Bought"? Auparavant, il était difficile d'expliquer et de laisser les gens comprendre "Crazy Bought". Après deux jours de pompage et de vidage, cela devrait être plus facile maintenant. charting on tradingview English FR Crazy Bought est un nouveau terme défini dans l'indicateur "9 Seasons Rainbow Multiple Time Frames Pattern", qui est l'une des 9 saisons: Bull (vert), Bull Pullback (vert clair), Résistance / Sur achat (Jaune), Crazy Bought (Lime), Neutre (Blanc) , Ours (rouge), Bear Bounce (rouge clair), Soutien / Survente (bleu), Crazy vendu (Fuchsia). Définition: Achat fou (citron vert): Le prix monte avec une forte volatilité, pourrait être une évasion valide, ou un piège à taureau. Définition: Résistance / surachat (Jaune): une zone de résistance pouvant devenir un sommet ou être percée. Evolution de Crazy Bought (Lime): Lorsque la résistance est d...

マッドバイとは何ですか?

Image
買われ過ぎはトレーダーにはよく知られています。 しかし、「クレイジーバイ」とは一体何でしょうか。 これまでは、「クレイジーな購入」を説明して理解させることは困難でした。 2日間の急上昇と小さな滝の後、それは今もっと楽になるでしょう。 charting on tradingview Source English ソース 買いは「9 Seasons Rainbow Multiple Time Frames Pattern」指標で定義されている新しい用語で、9つの季節のうちの1つです:牛(緑色)、牛のリトレースメント(薄い緑色)、圧力/買われ過ぎ(黄色)、狂牛病(明るい緑色)、中立(白色) )、ベア(赤)、バウンス(淡い赤)、サポート/売られ過ぎ(青)、マッドセル(紫)。 定義:マッドバイ(明るい緑色):価格が高ボラティリティで上昇する、効果的なブレークスルー、または長い罠かもしれません。 定義:圧力/買われ過ぎ(黄色):圧力ゾーンが上になるか壊れている可能性があります。 マッドバイの進化(明るい緑色): 圧力ゾーンが破られると、圧力/買われ過ぎ(黄色)は気が狂います(薄緑色)。 価格が範囲を超えている場合、これは成功した画期的な、明るい緑色の拡張機能です。 価格が新しいレベルまで上昇してそこに留まると、マッドバイ(明るい緑色)は牛のリトレースメント(薄い緑色)になります。 価格が範囲内に戻った場合、これは失敗して買わず(明るい緑色)、買われ過ぎ(黄色)に戻ります。 マッドバイ(ブライトグリーン)シグナルの価値: 狂った買い(明るい緑色)が最短時間で表示される場合は、もっとすぐにやることを検討してください。 マッドバイ(明るい緑色)が中または長期の時間帯に表示される場合は、マルチシグナルの短時間のディメンションを待つか、リボンが緑色になるか、または従来のMACD、RSI、STOCHASTICなどを使用してください。 マッドバイ(明るい緑色)が黄色に変わったら、ロングポジションを閉じるかショートします。 単色バンドの明るい緑色は弱い信号であり、特定のパターンを持つ明るい緑色は有益な取引の可能性が高いです。 (パターンに関する他のチュートリアルを参照してください) 停止設定:水平方向のキャビネットの上部境界の下に停止を設...

9 Seasons Rainbow - Multiple Time Frames Associated Price Wave Pattern Indicator

The indicator discovers profitable patterns by associating Price Season of multiple time frames. Full Name: 9 Seasons Rainbow - Multiple Time Frames Associated Price Wave Pattern Indicator This is redefined from “9 Seasons Rainbow Indicator PRO”, with clearer definition of 9 Seasons and user manual. Version: Invite-Only PRO Language: English Copyright: 2019 Indicator Location ---------- How to use the indicator ---------- Go through the manual and related ideas underneath or follow the tutorials list. Look through the profitable patterns and related cases, wait for or set alert for specific profitable pattern. ---------- Definition: 9 Seasons ---------- A life cycle of Price Wave is divided into 9 Seasons. Each time frame, from 5 minute to 1 month, has 9 seasons, Independent of each other: Bull (Green) Bull Pullback (Light Green): a pullback or retracement Resistance / Overbought (Yellow): a resistance area, may become a Top, or be broken through. Crazy...

Tutorial 4: Right Shoulders Indicated Only in 5M Frame by 9 Seasons Rainbow

Image
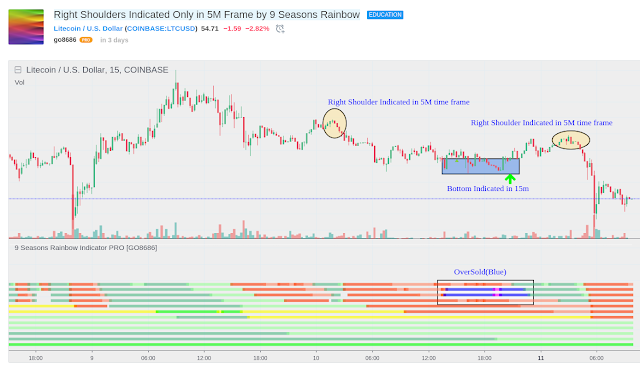
5M is too small for most people, however, it provides important signals that bigger time frames does not. LTCUSD has formed two shoulders yesterday, which are indicated on 5M time frame by "9 Seasons Rainbow Indicator PRO". These OverBought (Yellow) signals helped me stop manually the long trade in Breakeven. Charting by tradingview Source of Education Idea 5m 7m Overbought(yellow) itself is not strong enough, but when combined with the big context: Overbought(yellow) or Bear(Red) in big time frames (>2H), Right Shoulders can be indicated. ##################### DISCLAIM ################### This is only a personal opinion and does NOT serve as investing NOR trading advice. Please make their own decisions, carefully assess risks and be responsible for your own investing and trading activities.

Tutotial 2: BottomFinder: Long Signals of OverSold above Bull or BullRest

Image
This education idea uses "9 Seasons Rainbow Indicator" to discuss long trade signals based on specific scenario. The combinations of seasons on different time frames form patterns; some patterns have high probability of success for trading. "Long Signals of OverSold above Bull or BullRest Seasons" is one of the best signals, which serves as a bottom finder. Charting from tradingview Source of Education Idea OverSold on small time frame + Bull or BullRest on big time frames normally indicates a bottom. When the bottom is tested again and confirmed, it may be a good time for long trade. Instances: Please scroll to the time for details. 20190223 09:30 20190217 20:00 20190214 15:00 20190127 13:00 20190106 09:00 20190104 21:00 20181228 11:00 This post also use "Profitability Meter for Day Trading" to see the possible profit of the trades. ##################### DISCLAIM ################### This is only a personal opinion and does NO...