Posts

Showing posts with the label BTCUSD

比特幣下跌通道交易策略2019年七月

Image
本視頻回顧了比特幣兌美元在2019年七月的下跌行情中的交易機會。 分析基於“九季彩虹交易指標”的信號系統。 放空信号: Green - Red on 15m-30m + Yellow on 1H - 2H + Green 背景 Yellow - Red on 15m--1H + Red or Yellow 背景 Green - Red on 15m - 1H + Red or Yellow 背景 靠近通道上沿 做多(小仓位)信号 : 多个 Blue - Green + Red 背景 靠近通道下沿 欢迎联系指标作者要求免费试用 九季彩虹交易指标图表平台:http://bit.ly/chartingplatform 九季彩虹交易指标(9 Seasons Rainbow Multiple Time Frames Pattern) 适用于数字加密货币,外汇,黄金,石油,股票等交易资产的趋势走势预测分析。 ------------------------风险提示----------------------- 在观看本视频和本频道内容之前,用户认可已经完全了解和接受: 本视频, 本频道的内容,以及介绍和链接的所有资源,包括但不限于: 视频内容,文字描述,交易指标,工具,交易平台,网站,博客,电子邮件,评论,问题解答等资源,仅为个人观点,仅供研究,测试和模拟交易目的。不提供任何赢利的确定性,不构成投资交易建议。 用户如果将上述内容用于真实交易或者投资,需要自行承担所有风险! ----------------Charting on tradingview----------------

Trade Strategy for Bitcoin in Descending Channel

Image
charting by tradingview Symbol:  Bitcoin   ,  BTCUSD   ,  XBTUSD   Context:  Descending Channel   Charting Timeframe: 15m - 11H  Short Signals:  Green->Red on 15m-30m + Yellow on 1H - 2H + Green Context  Yellow -> Red on 15m--1H + Red or Yellow Context  Green -> Red on 15m - 1H + Red or Yellow Context  Zone near upper border of the  Descending Channel   Long(Small Position) Signals:  Multiple Blue -> Green + Red Context  Zone near lower border of the  Descending Channel   Trade Setup Examples  Long trade a bounce: Target Reached  Short the end of a bounce: Target Reached  

比特币和数字加密货币行情分析走势预测20190613

Image
比特币BTCUSD,XBTUSD,LINKBTC, 莱特币LTCBTC,以太坊ETHBTC,币安币BNBBTC,数字货币,加密货币 2019年6月13日行情走势分析预测. 今日币王: LINKBTC, 1小时涨幅50% 比特币在7900-8000点盘整并且出现多头钝化之后,回踩之前绘制的支撑区域,最低点刚刚好是支撑箱体的底线,而后用小台阶的节奏逐步上攻7900-8000阻力位,并且有效突破8100,也就是从六月五号至今的盘整底部区域。这个突破的含义重大,标志着多头已经夺回主动权。 后续走势:阻力区钝化后回踩支撑,下周看能否克服上方阻力区和前高。 以太坊ETHBTC 5% 上涨, 支撑有效, 箱体内运行 莱特币LTCBTC 如预期回调10%,企稳依旧看多。 币安币BNBBTC如上期视频所分析,突破上升三角(黄色-亮绿色) 上探 前期高点, 2 days 涨幅10%, 目前回调整理,个人计划在回调起稳继续做多. 欢迎联系指标作者要求免费试用 九季彩虹交易指标图表平台: 我使用的虚拟货币交易所: ------------------------风险提示----------------------- 在观看本视频和本频道内容之前,用户认可已经完全了解和接受: 本视频, 本频道的内容,以及介绍和链接的所有资源,包括但不限于: 视频内容,文字描述,交易指标,工具,交易平台,网站,博客,电子邮件,评论,问题解答等资源,仅为个人观点,仅供研究,测试和模拟交易目的。不提供任何赢利的确定性,不构成投资交易建议。 用户如果将上述内容用于真实交易或者投资,需要自行承担所有风险! charting on Tradingview

Tuto 6: Is Divergence the King or Queen of Crypto Technical Analysis?

Image
Divergence is one of the best technical analysis theories. Although not 100%, a very high probability of profitability is well known.  tradingview Source of the article This idea lists most of the instances of divergence on BTCUSD (Coinbase) since $19892 summit of December 2017 on 2H interval.  Indicators used:  RSI  MACD  9 Seasons Rainbow Multiple Time Frames Pattern PRO  Base Time Frame: 2H, most upper ribbon of "9 Seasons Rainbow"  Longest Time Frame: 90H (3D + 18H), most lower ribbon of "9 Seasons Rainbow"  Instances of Bullish Divergences (Green Arrows)  29 instances, probability of profitability > 85%  Signals:  Blue ascending arrows in RSI & MACD  Blue Ribbons in "9 Seasons Rainbow"  Instances of Bearish Divergences (Red Arrows)  17 instances, probability of profitability > 90%  Signals:  Yellow descending arrows in RSI & MACD...

QU'EST-CE QUE CRAZY ACHETÉ (CHAUX)?

Image
Le surachat est bien connu des commerçants. Mais, qu'est-ce que "Crazy Bought"? Auparavant, il était difficile d'expliquer et de laisser les gens comprendre "Crazy Bought". Après deux jours de pompage et de vidage, cela devrait être plus facile maintenant. charting on tradingview English FR Crazy Bought est un nouveau terme défini dans l'indicateur "9 Seasons Rainbow Multiple Time Frames Pattern", qui est l'une des 9 saisons: Bull (vert), Bull Pullback (vert clair), Résistance / Sur achat (Jaune), Crazy Bought (Lime), Neutre (Blanc) , Ours (rouge), Bear Bounce (rouge clair), Soutien / Survente (bleu), Crazy vendu (Fuchsia). Définition: Achat fou (citron vert): Le prix monte avec une forte volatilité, pourrait être une évasion valide, ou un piège à taureau. Définition: Résistance / surachat (Jaune): une zone de résistance pouvant devenir un sommet ou être percée. Evolution de Crazy Bought (Lime): Lorsque la résistance est d...

マッドバイとは何ですか?

Image
買われ過ぎはトレーダーにはよく知られています。 しかし、「クレイジーバイ」とは一体何でしょうか。 これまでは、「クレイジーな購入」を説明して理解させることは困難でした。 2日間の急上昇と小さな滝の後、それは今もっと楽になるでしょう。 charting on tradingview Source English ソース 買いは「9 Seasons Rainbow Multiple Time Frames Pattern」指標で定義されている新しい用語で、9つの季節のうちの1つです:牛(緑色)、牛のリトレースメント(薄い緑色)、圧力/買われ過ぎ(黄色)、狂牛病(明るい緑色)、中立(白色) )、ベア(赤)、バウンス(淡い赤)、サポート/売られ過ぎ(青)、マッドセル(紫)。 定義:マッドバイ(明るい緑色):価格が高ボラティリティで上昇する、効果的なブレークスルー、または長い罠かもしれません。 定義:圧力/買われ過ぎ(黄色):圧力ゾーンが上になるか壊れている可能性があります。 マッドバイの進化(明るい緑色): 圧力ゾーンが破られると、圧力/買われ過ぎ(黄色)は気が狂います(薄緑色)。 価格が範囲を超えている場合、これは成功した画期的な、明るい緑色の拡張機能です。 価格が新しいレベルまで上昇してそこに留まると、マッドバイ(明るい緑色)は牛のリトレースメント(薄い緑色)になります。 価格が範囲内に戻った場合、これは失敗して買わず(明るい緑色)、買われ過ぎ(黄色)に戻ります。 マッドバイ(ブライトグリーン)シグナルの価値: 狂った買い(明るい緑色)が最短時間で表示される場合は、もっとすぐにやることを検討してください。 マッドバイ(明るい緑色)が中または長期の時間帯に表示される場合は、マルチシグナルの短時間のディメンションを待つか、リボンが緑色になるか、または従来のMACD、RSI、STOCHASTICなどを使用してください。 マッドバイ(明るい緑色)が黄色に変わったら、ロングポジションを閉じるかショートします。 単色バンドの明るい緑色は弱い信号であり、特定のパターンを持つ明るい緑色は有益な取引の可能性が高いです。 (パターンに関する他のチュートリアルを参照してください) 停止設定:水平方向のキャビネットの上部境界の下に停止を設...

狂买是个什么东东?

Image
超买是交易者所熟知的。 但是,究竟什么是“狂买”? 以前,很难解释,让人们理解“狂买”。 经过两天的暴涨和小瀑布,现在应该更容易了。 charting on tradingview Source English 中文原文 狂买是“9季彩虹9 Seasons Rainbow Multiple Time Frames Pattern”指标中定义的新术语,是九季之一:牛(绿色),牛回撤(浅绿色),压力/超买(黄色),狂买 ( 亮绿),中性(白色),熊(红色),熊反弹(浅红色),支撑/超卖(蓝色),狂卖(紫红色)。 定义:狂买(亮绿):价格在高波动中上涨,可能是一个有效的突破,或者是一个多头陷阱。 定义:压力/超买(黄色):压力区域,可能成为顶部,或被突破。 狂买(亮绿)的演变: 当压力区被突破时,压力/超买(黄色)成为狂买(亮绿); 当价格保持在范围区域之上时,这是一个成功的突破,亮绿延伸; 当价格上涨到一个新的水平并停留在那里时,狂买(亮绿)成为牛回撤(浅绿色); 当价格回落到区间范围内时,这是一个失败的突破,狂买(亮绿)转回超买(黄色)。 狂买(亮绿)信号的价值: 当狂买(亮绿)出现在最短的时间维度上时,可以考虑马上做多。 当狂买(亮绿)出现在中期或长期时间范围内时,等待短时间维度的做多信号,其色带变为绿色,或使用传统的MACD,RSI,STOCHASTIC等。 当狂买(亮绿)变为黄色,关闭多头头寸或做空。 单色带中的亮绿是弱信号,具有特定模式的亮绿才具有获利交易的高概率。 (请参阅其他有关模式的教程) 停止设置:在横盘箱体的上边界下设置停止,留出一段距离。 市场很复杂,高风险伴随高回报。 (90%的时间) 压力/超买(黄色)通常意味着多头在该时间框架内耗尽,因此做空是合理的。 然而,一些隐藏的大鳄可以突然操纵/影响价格,尤其是在小时间维度。当依据压力/超买(黄色)信号开一个空头头寸时,如果黄色成为亮绿,应关闭空头头寸。 狂买(亮绿)通常意味着突破,所以做多是合理的; 然而,突破可能会失败,所以当亮绿反转为黄色时,关闭多头头寸。 有关其他8季的详细信息,请参阅指标页面: https://www.tradingview.com/scrip...

BITCOIN IS RUNNING OUT OF GAS, A PULLBACK MAY HAPPEN SOON

BITCOIN   (BITFINEX:BTCUSD) is testing the upper border of the  ascending channel  . Two attempts were failed during the past hours. There may be another test, but with a high probability, a Pullback may happen soon.  Reasons:  Overbought / Resistance (Yellow) in 30 minute, and 42 minute time frames.  In 15 minute, a  Double Top  Pattern is formed.  MACD  Divergence in 30 minute  RSI  has Lower Top.  Hammer  on the top of 1 hour time frame.  There is strong support in 4130-4160, it is still too early to say if the support will work once more.  If you find this idea reasonable, please like it, I appreciate your thumbs up. People who like will have a bonus of Four-Day free trial of -"9 Seasons Rainbow Multiple Time Frames Pattern STANDARD Indicator".  If you love it, or if you hate it, leave your comment or your point of view. People who comment will have a bonus of one-week free trial of -"9 Seasons R...

Tutorial 6: When Trends of Different Time Frames Conflict

Image
Trading is complected, because Price is superimposed wave of price activities on different time frames. Charting on Tradingview Source of the Idea When trends on short, medium and long term time frames move in the same direction, price trend is clear, as a whole. On the other hand, when trends on different time frames against each other, range happens and price trend is hard to predict. This happened within the past two days on BTCUSD . On short term to medium term time frames (15 minute -> 2H), there were multiple Oversold/Support (Blue) signals, which indicated strong support. On long term time frames (169 minute, 4H), there were Bear (Red) signals. On 339 minute, there was Overbought/Resistance (Yellow) signal. On 4H, 678 minute, there were Bull Pullback (Light Green) signal. Blue and light green is for Bull, while Red and Yellow is for Bear. The against-each-other pattern reflects the range situation of the market. Bull and Bear both believe their side will win...

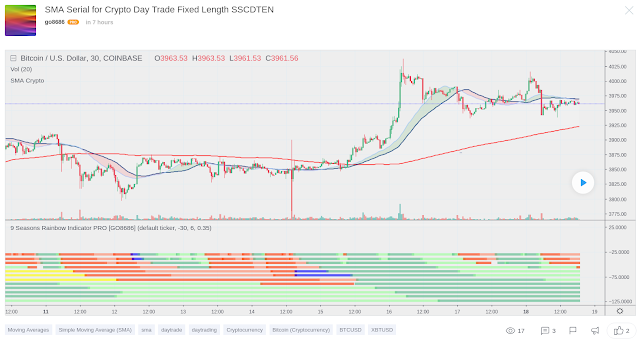
Indicator: SMA Serial for Crypto Day Trade Fixed Length SSCDTEN

Image
Crypto market is different from other financial markets  This indicator plot  SMA  series that fits Crypto,  esp   BTCUSD   ,  XBTUSD   Good for 5m - 1H time period for Day Trading.  Specific  SMA  can be toggle on/off  Charting by tradingview Source of the Indicator ---------- Française ----------  Le  marché de la crypto-monnaie est différent  des  autres marchés financiers  Cet indicateur série  SMA  qui correspond à Crypto-monnaie, en particulier  BTCUSD   ,  XBTUSD   Bon pour 5m - 1H période pour  le  day trading.  SMA  spécifique peut être activé / désactivé  ---------- 中文 ----------  加密货币市场与其他金融市场不同  该指标绘制了适合加密货币的SMA系列,特别是BTCUSD,XBTUSD  适合5分钟 - 1小时 日间交易时间段。  特定SMA可以打开/关闭  ----------日本語----------  暗号通貨市場は他の金融市場とは異なります  この指標は、暗号通貨、特にBTCUSD、XBTUSD用のSMAシリーズを描画します。  5分から1時間の取引期間に適しています。  特定のSM...

Bitcoin은 상승 채널을 따라 효과적인 지원을 얻습니다.

Image
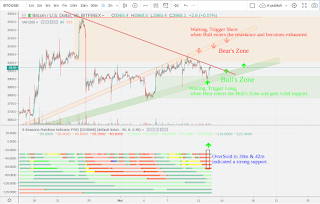
Bitcoin의 최근 반등은 Upside 채널의 유효성을 검증합니다. "Bitcoin의 현재 지원, 저항 및 상승 채널"에 대한 이전 견해를 참조하십시오.  위의 압력 수준은 4000usd (BITFINEX :  BTCUSD   )로 조정되며 새로운 추세선이 압력을 생성 할 수 있습니다.  30 분과 42 분의 과매비 (파란)는 리바운드 전에 조기 경고했다.  일중 거래를 준비하고 콜백이 안정된 후에 소량을 만듭니다.  "9 Seasons Rainbow Indicators"에서 "oversold (blue)"의 정의에 대해 궁금하거나 선호하는 거래에서 지표가 어떻게 작동하는지 알고 싶다면 아래 부록에 링크되어있는 자료를 참조하십시오.  ---------- 면책 조항 ----------  그것은 단지 개인적인 의견이며 투자 거래 자문을 구성하지 않습니다.  사용자는 독립적 인 판단을 내리고 조심스럽게 평가하고 투자 및 거래의 위험을 감수해야합니다!  영어가 우선한다.  ##################### DISCLAIM ###################  This is only a personal opinion and does NOT serve as investing NOR trading advice.  Please make their own decisions, carefully assess risks and be responsible for your own investing and trading activities. 

BITCOIN GOT VALID SUPPORT ALONG CHANNEL PREDICTED

Image
Bitcoin just bounced from the support as I charted 2 days ago in the idea " Bitcoin's Support, Resistance & Ascending Channel for Next Week ". The Ascending Channel is maintained pretty well, while the upper Resistance is lowered a bit to 4000 USD (Bitfinex:BTCUSD). A new Resistant Trend Line is added, which might be a new Resistance. Charting by tradingview Sibling Page in Charting Platform Before the bounce, OverSold appeared in 30m & 42m, indicated the strong support. ##################### DISCLAIM ################### This is only a personal opinion and does NOT serve as investing NOR trading advice. Please make their own decisions, carefully assess risks and be responsible for your own investing and trading activities.

Tutorial 3: Why Do People Ignore the Foot Steps of a Huge Bear

Image
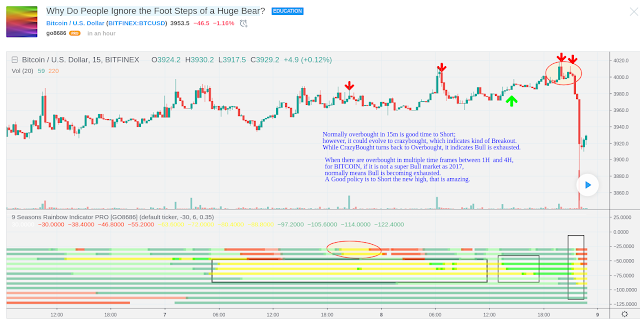
A DUMP just happened, as alerted in my last idea <<BITCOIN is Overbought, a big pullback may happen soon>> of yesterday. Not many people agreed with me. I have another education idea <<Yellow, the Color that Predicts Dump of Bitcoin>>, which listed all the Tops indicated by <<9 Seasons Rainbow Indicator>> since November 2018 in 15m time frame. Charting by tradingview Source of Education Idea Normally overbought is good time to take the profit; however, it could evolve to crazybought, which indicates kind of Breakout or a final bull run. While CrazyBought turns back to Overbought, it indicates Bull is exhausted again. When there are overbought in multiple time frames between 1H and 4H, for BITCOIN , if it is not a super Bull market as 2017, normally means Bull is becoming exhausted. A Good policy is to Short the new high, that is Amazing. Tips: 9 Seasons Definition in <<9 Seasons Rainbow Indicator>>: ---------- 9 Seas...

Tutorial 1: Yellow, the Color that Predicts Dump of Bitcoin

Image
Bitcoin is famous for high volatility and all kinds of traps that happen at anytime. When a dump ended a bullish run, people got sucked. Is there a way to lock maximum profits from your existing long positions and to avoid opening new long positions before a dump?  Charting by  tradingview Link to Education Idea                                                                                              The solution is the color Yellow. Yellow represents OverBought, which is one of the seasons of market life cycle in "9 Seasons Rainbow Indicator". Let's have a look at two related seasons' definition: OverBought (Yellow): may have defined a top or resistance, can happen in range, evolves into CrazyBought (Lime) or Bear (Red). CrazyBou...